

 Bug: Timeline Financials
Currently Quarters Financial section within the stock GME do not line up. There are revenues posted for Q4'17 which I think should be Q4'16 and this impacts the entire overview

Problems for two 'Surprise'-related stats
1. For 'Percent EPS Surprise for MRQ', decimal point needs to be shifted two places to the left.
2. For 'Most Recent Quarter Surprise', when in Screener mode, cannot specify 'Between' percents.
 OSV Users' Favorite Custom Screener
Jae,
Suggest having OSV users submit their personal favorite custom screener (preferably also with a description as to why they use it). You would review the submissions and pick one or more to share with all users.
The primary benefit of this would be to help users become more engaged with the great custom screening capabilities of OSV.
Thank you for your consideration,
Jeff

"Your Screen" Edit function
For user-developed custom Screens, when in the "Your Screen" area and attempt to "Edit" the display column headings, we are returned to the "Basic" column headings instead of staying with the "Your Screen" headings. So, when in "Your Screen" display, unable to Edit column headings or change order of column headings like we can when in Basic, OSV Ratings, etc. categories.
Future 'Charts' Section Ideas
Jae, Could you please update us on any progress and plans on the future 'Charts' section? (This might be worthy of a post on your blog).
Three suggestions for beginning this section:
- For one user-selected company ticker, provide line graph showing stock price % change for user-selected timeframe (1 month, 3 months, YTD, or 1 year).
- Allow user to select overlay(s) to stock price chart in #1 above of the S&P 500 and/or that company's industry performance for the same timeframe as selected in #1.
- Allow stock price comparison line graph overlays for up to 4 user-selected tickers for any one of the 4 timeframes (same timeframe choices as in #1 above).
In addition, the comparisons in #1 through #3 above are 'price performance' metrics that could be added as screener variables. This would be a great addition for users who like to screen stocks based on 'price performance' metrics.
Summary page 'Company' info
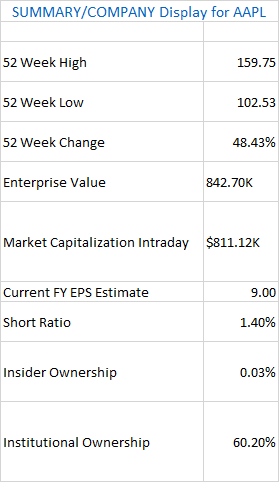
1. Enterprise Value and Market Cap should be B not K.
2. Market Cap value should be as of market close (i.e. same as Enterprise Value is), rather than Intraday highest value.
Two Altman Z Score Problems
1. Market Value of Equity uses K ($Thousands) rather than B ($Billions) for TTM (trailing twelve months).
2. Delete MRQ calculations. Z Scores should only be used for 12-month periods -- X3(EBIT) and X5(Sales) are understated if use only 3-month values.
Add 'Average Fair Value Margin of Safety' as a Screener filter
Thank you for your consideration of this idea.
Customer support service by UserEcho

