Your comments
Are you close to correcting the 'Growth Estimate' Errors?
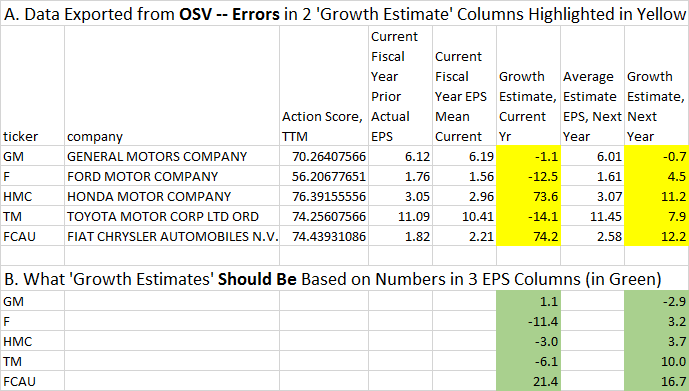
All OSV 'Growth Estimate' data points I just exported from OSV and shown below are wrong (highlighted in yellow). Note: I am providing correctly calculated numbers highlighted green:

For example look at Honda: If Current FY Prior EPS is $3.05 and Current FY EPS Estimate is $2.96, then the actual % Change would be -3.0 (highlighted in green), not the 73.6 (highlighted in yellow).
EPS Growth Estimates are a very important consideration when analyzing any company when considering whether or not to invest. Please correct this bug as soon as possible.
Using Schwab numbers, GM and F numbers are same as OSV except for Current FY (2017) EPS Estimate which they show as 6.10 for GM and 1.55 for F. Using these two numbers the Growth Estimate % Change Numbers for This Year and Next Year would be identical to what you show in OSV. So, perhaps you could look at updating your Current Year Estimates more frequently to agree with current analysts' estimates.
Interesting to me that GM and F are two U.S.-based companies and the Schwab numbers are very close to OSV. The other 3 are International-based companies and OSV numbers are very different than Schwab's which are:
| 2016 EPS | 2017 | 2018 | |
| HMC | 1.59 | 3.16 | 2.97 |
| TM | 12.35 | 10.89 | 10.18 |
| FCAU | 1.31 | 2.37 | 2.62 |
Unfortunately, I don't know the data source used by Schwab for International-based companies.
Hope this information is helpful in targeting the differences.
Customer support service by UserEcho


Thank you for agreeing to correct these OSV display outputs via calculations.
One added request when you do that: Whenever you show a % change number in all OSV outputs, can you change the format of the display to also show its % sign? For example, in highlighted green numbers (for GM) in chart above, you would show 1.1% and -2.9%, which provides better clarity for us users.