Color Coding Explanation
Here's an outline of the main color coding methods used in OSV Online.

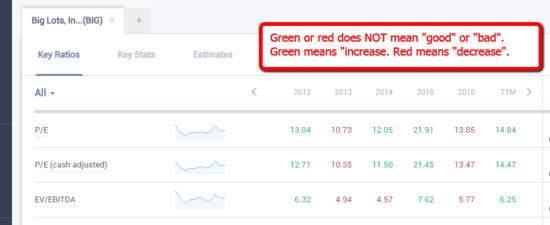
GREEN means up or increased. It does not signal "improvements" or "better".
RED means down or decrease. It does not signal "bad" or "sell".
E.g. if PE increased from 10 to 20, is that good or bad?
If you're holding the stock, it appreciated and you may believe it's a good growing company.
If you don't hold the stock, you may believe that is bad and overpriced.
That is why colors in OSV Online do not represent "good" or "bad". It simply represents an objective "increase" or "decrease". How you interpret the number is then up to you.
(The exception is for the OSV Ratings, where A grade stocks DO represent stocks being better than a F stock.)

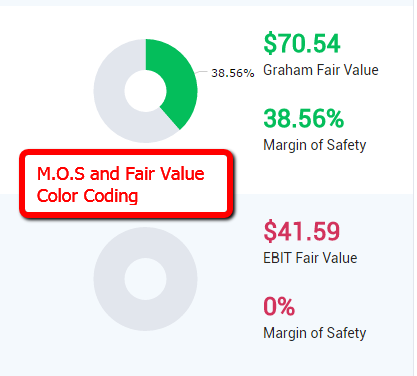
Margin of Safety color coding is also the same concept.
If the margin of safety is red, it means it is below the standard 25% MOS from the stock price or the value you entered.
If the MOS % is green, it means it is above the 25% threshold.
Fair Value color coding is also simple. If the fair value is above the stock price, it is green.
If it is below the stock price, it is red.
Keep that in mind because I've had people who automatically think it is a "better" or "worse" number depending on the color.
Customer support service by UserEcho
