How to Value Stocks Using Absolute PE
What You Will Learn
- How to value stocks using an fundamentals based Absolute PE model
- How to adjust a PE in order to stop relying on misleading relative valuations
- Advantages and disadvantages of the PE Model and why you should learn it
Absolute PE Model by Vitaliy Katsenelson
Back in 2011, I got around to reading and applying Vitaliy Katsenelson’s book Active Value Investing which I also list in my best investment books for value investors.
In it, he lays out a simply framework and valuation method which he calls the absolute PE model. I use this model in our Old School Value stock analyzer as an alternative to simply relying on relative valuations.
The common way people use multiples is to:
- compare the PE with a competitors
- if competitors have a higher PE, use the higher multiple and multiply it to the company’s projected earnings
- voila~ feel good about justifying the higher valuation
This type of valuation works for very simple ideas and during fairly valued markets. Most of the time when markets are cheap or expensive, this method uses the wrong multiple.
During recessions, if a quality stock is trading at a PE or 3, people tend to think there must be cockroaches and is deservedly cheap. You end up using a multiple of 5, when in hindsight, it should have been a PE of 15.
On the flip side, in expensive markets, the tide lifts all boats and even bad companies are trading a high multiples.
There is a lot of anchoring bias involved with any sort of multiples valuations in general.
The Absolute PE stock valuation method takes a different approach of increasing or decreasing the PE based on fundamentals.
If a stock has great fundamentals, its PE is increased accordingly instead of comparing it against competitors to justify the increase in PE. If the fundamentals are weak, then the PE is discounted to a cheaper level.
The Absolute PE is available on Old School Value Online which you can use for free for stocks like MSFT, FB, AAPL.
Understanding the Absolute PE Model
This valuation model derives the intrinsic value of a stock based on the following five conditions.
- Earnings growth rate
- Dividend yield
- Business risk
- Financial risk
- and earnings visibility
Like all valuation models, there is subjectivity involved.
Here, you are required to grasp an understanding of the business and then quantify the level of risk involved. Trying to decide the business risk level and assign a premium value to it or give it a discount is not the easiest thing. But there are guides in this model that makes it possible and worthwhile.
Core Principles of the Absolute P/E Model
Since this model is based on the workings of the 5 conditions mentioned above, it’s important to understand the big picture for each condition.
Instead of just trying to get the formula and start working on it, take a step back, look at the big picture and you’ll find it really easy to use this absolute valuation model.
Principal #1: Assigning a No Growth PE as a Start
Back in the day, Graham used a PE of 8.5 for a company with 0% growth.
I’ve changed my numbers to make a PE of 7 to be in line with no growth.
Part of the reason why I created the no growth PE screen backtest was because of this valuation method. My results show that a PE range of 7 to 8.5 is perfectly acceptable so you are free to use
whatever suits you.
An article I wrote that dives into the Graham number explains all this in detail. The original Graham’s Formula, not to be confused with the Graham Number, used 8.5 as the no growth PE and Katsenelson uses a PE of 8 in the book.
I on the other hand will stick with my PE of 7.
Why?
If you flip over the PE of 7, you get an earnings yield of 14.2% compared to 11.8% and 12.5% for Graham and Katsenelson respectively.
With the small caps I analyze and the fact that the Graham’s formula produces optimistic valuation numbers, demanding an earnings yield of 14.2% is better than 11.8%.
In a bullish market, demanding a 14.2% return is unrealistic, but that doesn’t mean I have to compromise.
It’s a simple criteria that works for me.
Now, if you mainly focus on analyzing large caps such as MSFT, XOM, or GE, it’s ok to keep the PE to 8.5.
Stock valuation is subjective. Your interpretation and thesis is more important than blindly creating or following someone else’s number.
Principal #2: Understand the Earnings Growth and PE Relationship
Logically, higher growth rates lead to a higher PE.
Peter Lynch came up with quick growth rate calculations by using the PE.
To Lynch, a PE of 12 was a good approximation of an EPS growth rate of 12%. PE of 20 is 20% growth rate.
However, this model doesn’t use a linear relationship.
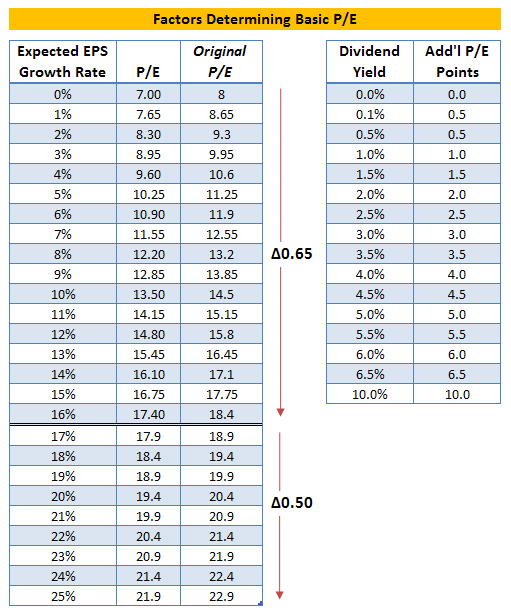
The absolute PE model is set up so that for every percentage of earnings growth from 0% to 16%, the PE increases by 0.65 points instead of 1 point.
If the growth rate reaches a certain level, in this case 17%, the PE value is increased by 0.5 points.
The reason for this is because you’ve witnessed many times that the higher the growth rate, the greater the fall from the top.
Refer to the table below to better understand the relationship between the stock’s PE and the expected EPS growth rate in the Absolute PE model.
The “Original P/E” column is what Katsenelson uses in the book. The “P/E” column is my adjusted number.
Absolute PE Model Table
Notice the difference that starting with a lower PE of 7 (my number) as no growth, actually gives it better growth stats the PE increases. For an expected 10% growth, my PE version is 13.5, whereas the original PE is 14.5.
For a stock like Microsoft (MSFT), where the he current PE is 28.14, the table above shows the expected earnings growth is at the cap of 25%. Katsenelson has capped the max growth rate of this model to be 25%.
For high growth stocks, you can that a company posting and expecting 100% growth will be outside the realm of this valuation tool.
Now, depending on the type of company, a premium or a discount is applied in the valuation stage. Rather than just giving
What this means is that a stock may get extra points for having a better earnings stability and predictability.
Think of it this way, the earnings visibility of Coca Cola (KO) or even Microsoft (MSFT) is clearer than Salesforce (CRM) or a cyclical company such as Caterpillar (CAT).
Principal #3: The Value of Dividends
Dividends are tangible to the investor whereas earnings are not. Dividends provide you with a hard return whereas you may never get to see earnings.
For this reason, a stock that gives dividends gets extra brownie points.
In the valuation model, every percentage of a dividend yield equals one extra point.
This contrasts the non linear relationship between earnings growth and PE as shown in the table above. The right side of the table shows how the points work for dividend paying stocks.
If the dividend yield is below 1%, the bonus point is 0.5.
Looking at MSFT again, the dividend yield of 2.47% means it gets 2 points. Not 2.5 points because it is lower than the required 2.5% threshold.
Principal #4 & #5: PE Factors for Business & Financial Risk and Earnings Visibility
When it comes to trying to determine the risk of a business, everyone has a different opinion.
This is where experience and knowledge of the industry plays a big role.
What you see as a risk may be overlooked by other and vice versa.
I may penalize MSFT for its business model whereas you may give it a premium. Same company but two different valuation results.
But you need to assign a single number to represent risk to utilize this model.
It’s the weakness of the model, but that’s the tradeoff when you try to keep things simple.
For business risk, you want to consider the industry the company is in, the products, the life cycle, concentration of products and customers, environmental risks and anything else related to the operations of the business.
The level of financial risk can be determined by examining the capital structure of the business as well as the strength of the cash flow in relation to debt and interest payments.
Earnings visibility is analyzed in much the same way.
Below are the risk points to use in the model.
- For an average company, you will want to assign a value of 1.
- For a market leader, select a number less than 1. If you believe a market leader deserves a 10% premium, then use a value of 0.9. If a 15% premium is deserved, then 0.85 is the number to use.
- For a market lagger, select a number greater than 1. Poor companies should be discounted. A 20% discount means a value of 1.2 will be used. Use 1.1 to penalize a stock by 10%.
Qualitative Aspects of the Absolute PE Value Model
Before moving onto examples of how this model is used, a couple of points made in the book should be discussed.
Put a Ceiling on Growth
Based on the business risk, financial risk and earnings visibility, additional PE points are added to the basic PE.
For example if a company is expected to have 10% earnings growth with 0% dividend yield, according to the table above, I would assign it a PE of 13.5.
Now, depending on how good the company is, additional PE points are added based on business risk, financial risk and earnings visibility.
Katsenelson writes that he limits the premium to the basic PE to be no more than 30%.
In other words, if the basic PE is 13.5, despite how good the company is, the final adjusted PE won’t be more than 17.55 (13.5 x 1.3=17.55).
If the basic PE is 10, then the ceiling will be limited to PE 13 (10 x 1.3 = 13).
Inflation and Interest Rates
The model assumes that inflation and interest rates are average and not expected to increase or decrease to dramatic new levels.
In the current environment, interest rates are still low.
If inflation and interest rates are expected to rise, then the zero growth PE should be adjusted down and vice versa. There is a caution against using current interest rates without considering the long term direction.
Finally. Putting it All Together.
Now the fun part of using examples. Facebook (FB) will be our guinea pig.
The formula to calculate the intrinsic value using the absolute PE method is as follows:
Fair Value PE =
Basic PE
x [1 + (1 – Business Risk)]
x [1 + (1 – Financial Risk)]
x [1 + (1 – Earnings Visibility)]
To get the Basic PE, you start with the current PE and add the extra dividend points.
For FB, the starting PE is 30 with no dividend yield. No extra points for FB.
Therefore the The starting Basic PE remains at 30.
For business risk, financial risk and earnings visibility, it’s easy to start guessing so I created a systemized and automatic method to do the scoring.
It’s available for free on the demo of the Absolute PE model.
Business Risk Analysis
Facebook Business Risk Evaluation
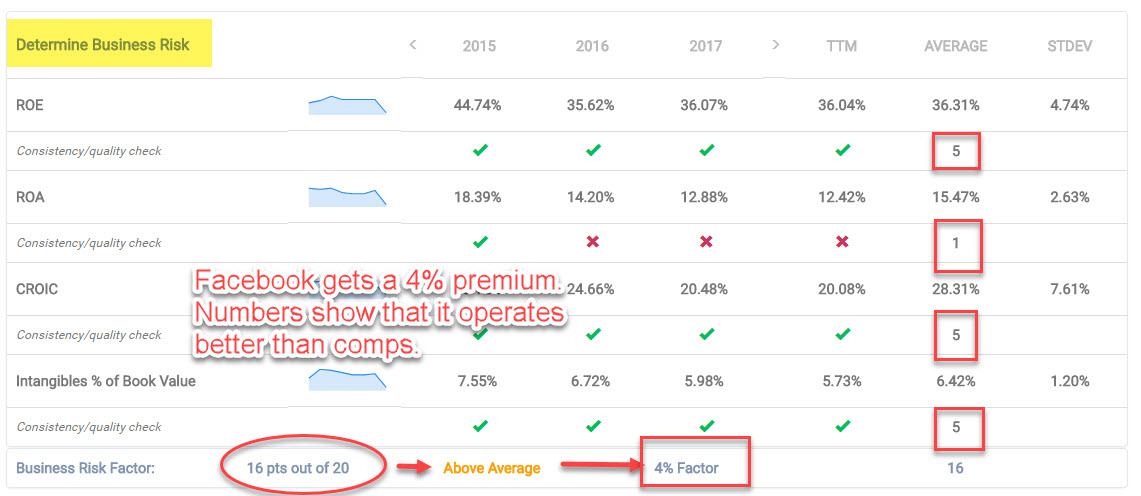
Starting with business risk evaluation, Facebook’s dominance isn’t going away anytime soon. Despite all the hysteria in the media about Facebook’s data scandal, one thing that became clear is that Facebook was not affected by the number of user accounts being deleted or activity going down.
The numbers we look at to determine business risk is to look at trends in ROE, ROA, CROIC and intangibles as a percentage of book value.
FB gets a 16/20 which is considered above average – thereby receiving a 4% premium to the base PE.
Financial Risk Analysis
Facebook Financial Risk Test
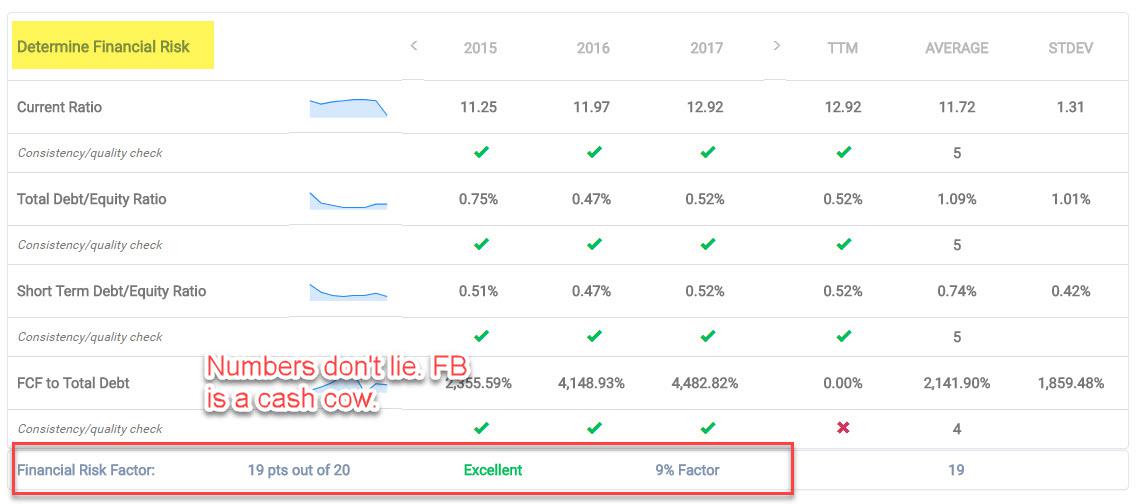
To quantify financial risk, I look at the current ratio, total debt to equity ratio, short term debt to equity ratio and FCF to total debt.
You can check some other balance sheet ratios or come up with your own.
Here FB scores 19/20 and receives a 9% premium to the valuation. Even if FB’s growth rate slows down, the company still generates a ton of FCF with no sign of bankruptcy nearby.
Earnings Predictability Factor
Facebook Earnings Predictability Test
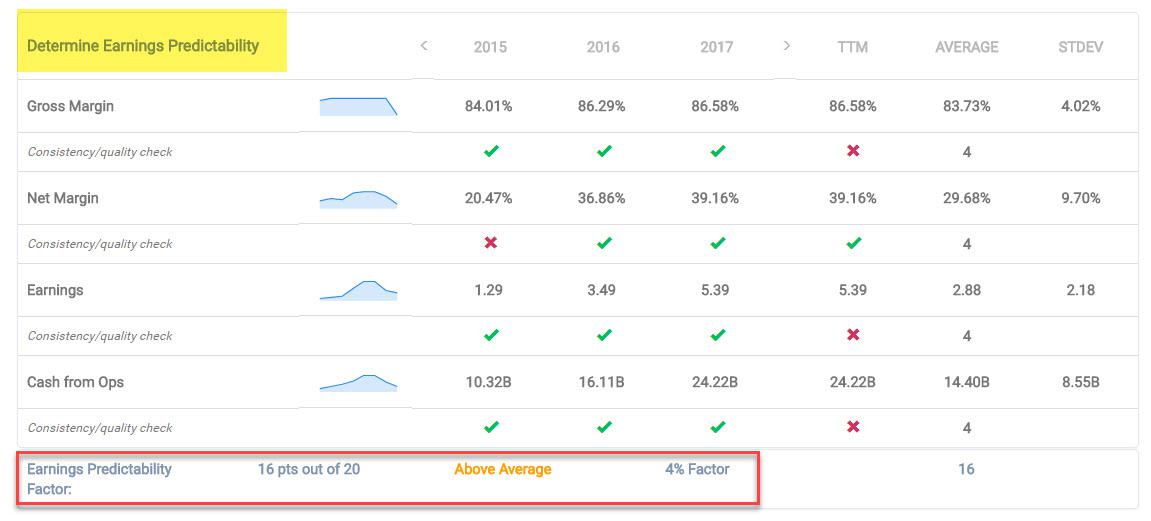
Facebook shows an above average result for earnings predictability based on the numbers I use to calculate this.
If the score was below 10, it would lose points in the final valuation. With a score of 16/20, Facebook still receives a 4% premium.
But let’s say you believe that due to the current news, it’s easily possible that margins and growth will decline. This is the time to manually override the default score from 11 to something like 8.
A score of 8/20 means earnings predictability is poor and will receive a penalty of 3%.
When you apply all this information into the Absolute PE formula, this is what the calculation looks like.
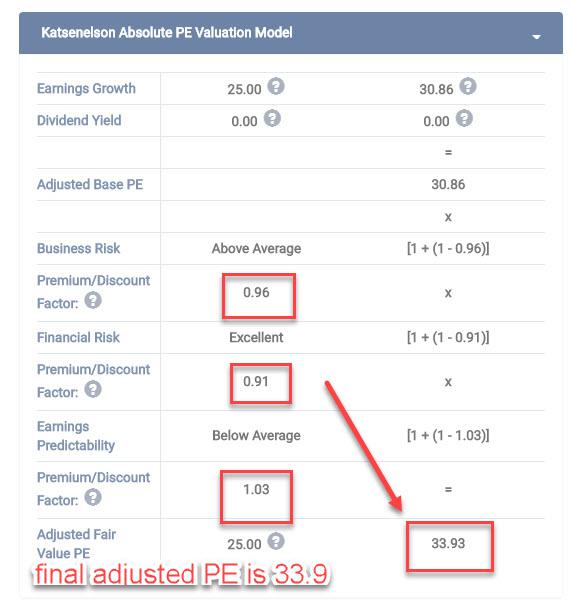
Facebook Absolute PE Calculation with new Fair Value PE
- Start with the original base PE of 30.86
- PE is increased by 4% for above average business
- PE is increased by 9% for excellent financial health
- PE is decreased by 3% for low earnings predictability
- New adjusted fair value PE is 33.9
The intrinsic value for a PE of 33.9 is $182 for a single scenario.
What you can also do update the scores to reflect a bear case scenario and bullish scenario to get a range.
Bear Case Example:
- Business safety is in danger due to regulation and huge number of accounts being deleted. Score is 5/20.
- Financial safety is compromised with lower margins and slowing growth. Score is 13/20.
- Earnings predictability is shot as the business model slowly crumbles. Score is 3/20.
- Final adjusted PE is 25.52
- Fair value for PE of 25.52 is $137
Bull Case Example:
- Business safety improves as regulation was just a scare tactic. Accounts deleted don’t make a dent. Score is 16/20.
- Financial safety is remains healthy. So much FCF, FB can’t spend it fast enough. Score is 19/20.
- Earnings predictability stabilizes and the data scandal is short lived. Score is 16/20.
- Final adjusted PE is 36.38
- Fair value for PE of 36.38 is $196
Summing Up: A Valuation Model to Add to Your Toolbox
Every company is unique and you can’t and shouldn’t use a DCF for every stock.
What the Absolute PE method will help you with is to apply a method that uses stock multiples in a much more isolated manner.
Instead of just focusing on the competitor multiples and trying to fit your stock to their standards, you can take a step back and use it in an absolute sense.
It’s easy to start plugging in numbers into a spreadsheet and believe what the numbers tell you. Instead, you should have a bunch of valuation models you can use for each scenario.
The Absolute PE model shows for stocks with positive earnings with low to moderate growth. Hyper growth companies will not work with this model as the growth rate is capped.
I regularly use the Absolute PE Method for my own stock valuations and if you don’t want to deal with the hassles of manually calculating the same thing across companies every time, then try out old school value.
The model does have subjectivity and the results will end up being only as good as the inputs, but it’s a technique that is easy to learn and apply.
Additional Reading
Disclosure: Long FB.
Customer support service by UserEcho
