[OSV Tutorial] Using OSV Online 101 - Basic instructions to hit the ground running
Here we go.
My goal in this tutorial series is to:
- get you comfortable using OSV Online
- help you understand how and why things work
- how to interpret and understand what you see
- how to apply it for yourself to pick winning stocks
- show you how to create a top 20 portfolio
- teach you the valuation methods and techniques used by active investors
- help you think through the stocks you are looking at
I also highly recommend NOT to unsubscribe from this Insiders Only email list because you'll miss out on valuable instructions, and member specific emails.
If you wait, go through the tutorials, follow the examples and spend a few minutes to apply it yourself, you'll be well prepared.
This first tutorial is a basic one to acquaint you with the navigating, color coding and other areas.
HOME PAGE
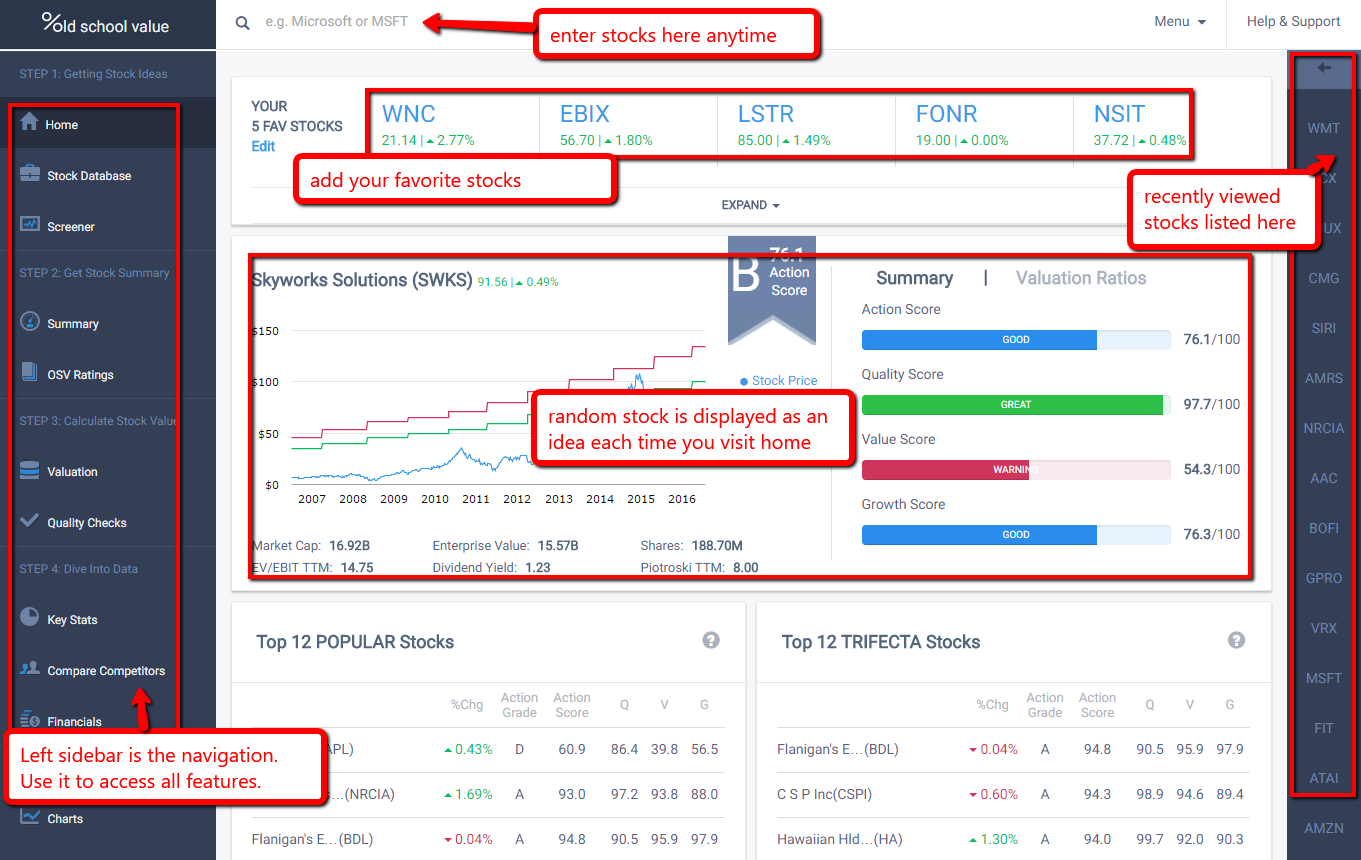
- Enter a stock into the search bar by the ticker or company name
- You can load up to 5 stocks simultaneously via tabs. Makes it easier to compare and go back and forth instead of having to load each one again and again
- Left sidebar is categorized into their respective workflows. I.e. places to get stock ideas is grouped together, valuations are together etc.
- You can click on company names in most places to load the stock immediately
- Home page displays a random A or B grade stock on the homepage for ideas. Hopefully you'll come across many stocks you've never heard or thought about.
- Widgets are also provided to give stock ideas
SHORT VIDEO OF EACH SECTION IN USE
As I'll be going into the details of each section in a later tutorial, here's a video that quickly gives you a high level view of what it is and how to use it.COLOR CODING
Throughout OSV Online, we use colors to make it quick and easy to visually interpret data.
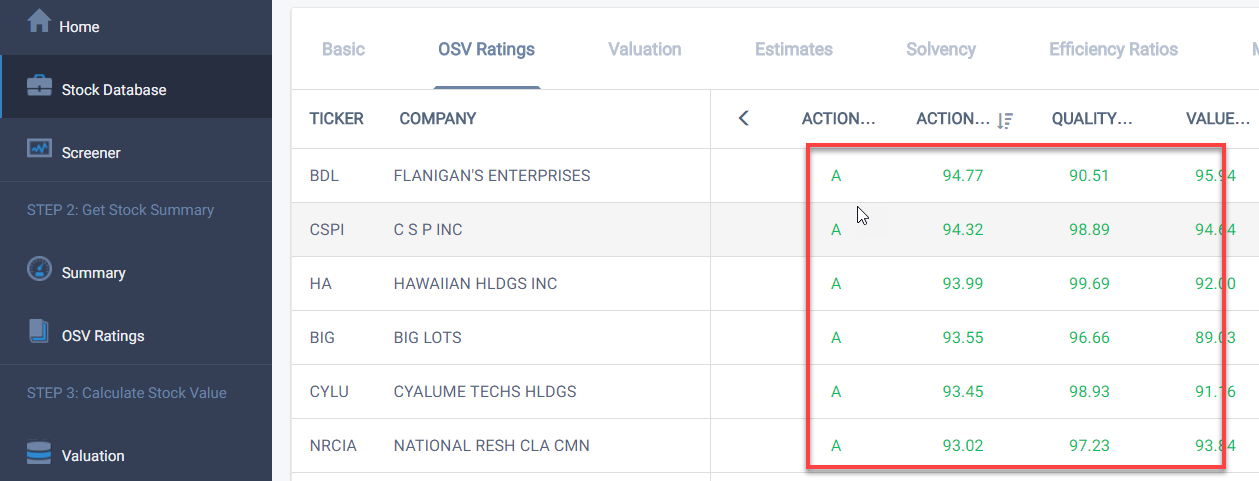
Stock Database and Screener Color Coding
Colors are used mostly for the Action Scores and Grades.
- A = Green
- B = Blue
- C = Orange
- D = Red
- F = Red
Valuation Color Coding
Red = stock price is above the valuation calculation (overvalued).
Also means that the margin of safety is below the required threshold of 25%.
Green means the stock is undervalued compared to the stock price (undervalued).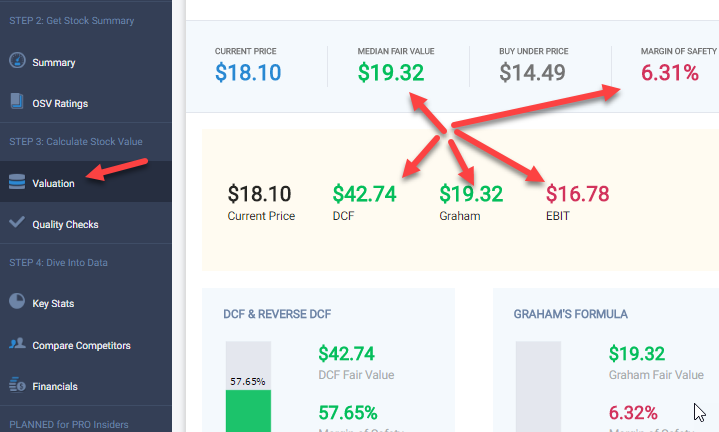
Key Stats and Financial Statements Color Coding
For the most part, we've tried to color code is so that good = green and bad = red.
But it's important that it doesn't apply to every single data point. Some people believe that increasing PE is good, while others say it's bad.
That's why in certain stats, the color coding is:
- Red = decrease from previous year
- Green = increase from previous year

Here's a screenshot of the financial statements.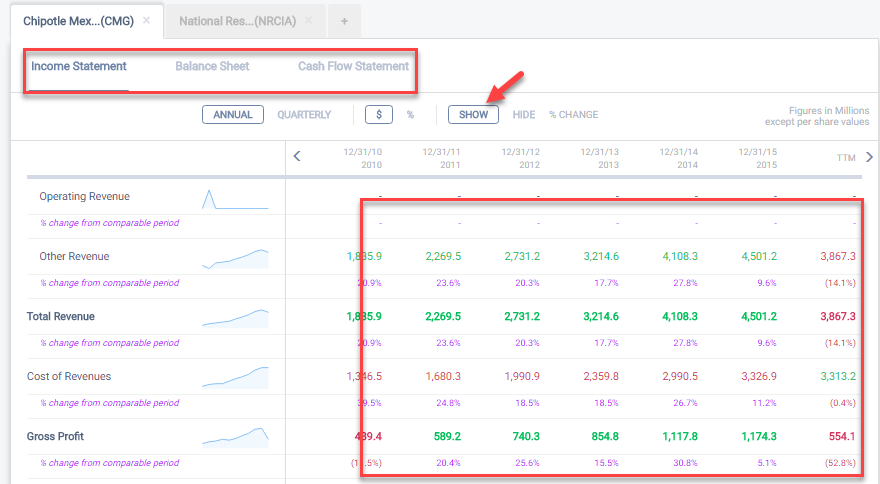
SUBMIT TICKETS AND FEEDBACK ANY TIME
If at any time you have a question, click the "Help & Support" button at the top right corner and I get it via my ticketing system.
For feedback or ideas, there is a little blue bar at the bottom of the app you can also click to submit ideas any time - or click this link
I go through it regularly to get a feel for what your needs are.
OUR GROWING DOCUMENTATION
I post these tutorials and videos in our knowledgebase. If you want can't wait for the whole series and want to dive right in, head over to our knowledgebase.
With that little intro out of the way, in the next email, I'll give you a tip on how to best utilize the tool to achieve daily "quick wins".
With thousands of stocks to choose from, it's all about making your life easier as you search for and analyze stocks.
Customer support service by UserEcho
